Tom Hembree, “Dad” of Dad & Dude’s Breweria, has been distributing the company’s beer to liquor stores and taverns for the past three years. In March 2015, he and his son, “Dude” Mason, decided to self-distribute to get a better handle on what the customer base actually wanted.
Hembree found that he could increase his sales volumes with a dedicated sales team, but soon found he needed to address inventory balance. For some products, he realized he had 14 weeks of inventory, for others, zero.
“One of the worst things that can happen is you make the sales but have no stock to replenish,” says Hembree. “You put all the work into making the sale and end up losing the shelf space because you have no inventory. On the other side, we found we spent thousands of dollars in cash over three to four months before we needed it, which really affects our cash flow.”
This is commonplace in the world of inventory management. Hembree thought he was doing a good job, but found the facts spoke for themselves. Hembree asked me for help, as one of his investors and avid homebrewer who he knew was involved in implementing inventory control systems around the world.
What he learned was a visual, easy to understand, state-of-the-art process. He summed his experience up in these seven steps:
- New technologies can and should be easy to understand.
- Make your decisions based on data and facts, not best guesses, feeling or thoughts.
- Make the data visual, A picture is worth a thousand words.
- Negotiate a consistent lead time with your suppliers.
- Determine what service level (on-time delivery) performance you need. 100 percent sounds great, but is mathematically impossible and ties up cash; think in the range of 98 to 99.99 percent.
- Size your inventory supply chain based on mathematical tools. Numbers don’t lie.
- Produce more beer only when the math says to do so.
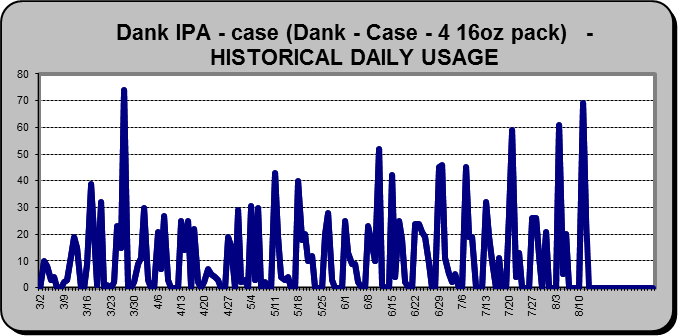
In the past, Hembree looked at weekly and monthly sales and sales projections. I told him the more detail the better, but when Hembree pulled daily sales data out of QuickBooks, it was daunting. Making the data visual however made it easier to see that he had sales that ranged from zero to 75 cases per day.
After reviewing supplier lead times and brewing time, we placed the data into the “Lead Time Bucket.” That is, if the lead time to produce more beer including planning time is 30 days, the daily data would be put into a 30-day rolling sum.
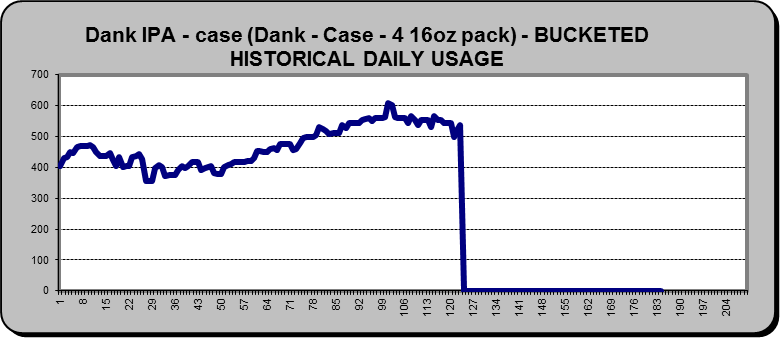
This step is extremely important since it shows how much supply chain inventory (on hand plus on order) is required to cover the lead time to get more. The graphic depiction clearly shows the 39 percent growth per year they have experienced for Dank IPA cans.
The next step was to apply statistics based on the service level that Hembree wants to provide to his customers.
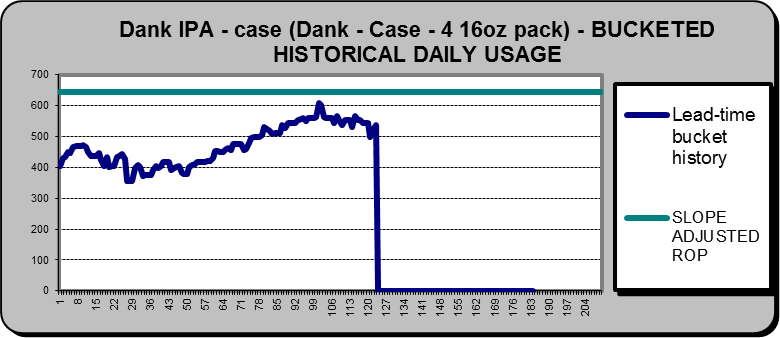
This graph shows that the brewery needs a supply chain inventory of 644 cases to accommodate the variation in sales, lead time variation and service level Hembree wants to provide to keep his customer happy and maintain and grow shelf space. Hem can also bring into the calculation forecast if there is a known event that will boost demand like GABF or holidays.
Now that Hembree knows his supply chain inventory should be 644, he is ready to begin ordering process. On an ongoing basis, he will compare how much inventory he has on hand and on order and compare it to the calculated supply chain inventory. If the total is greater than the calculated supply chain inventory, he does nothing. If on hand and on order are less than the calculated supply chain inventory, he orders another batch of ingredients.
The result? Higher service levels for customers with 40 percent less inventory and thousands of dollars positive cash flow.
Mike Henderson is founding partner of FlowVision, LLC. Contact Mike at henderson@flowvision.com

